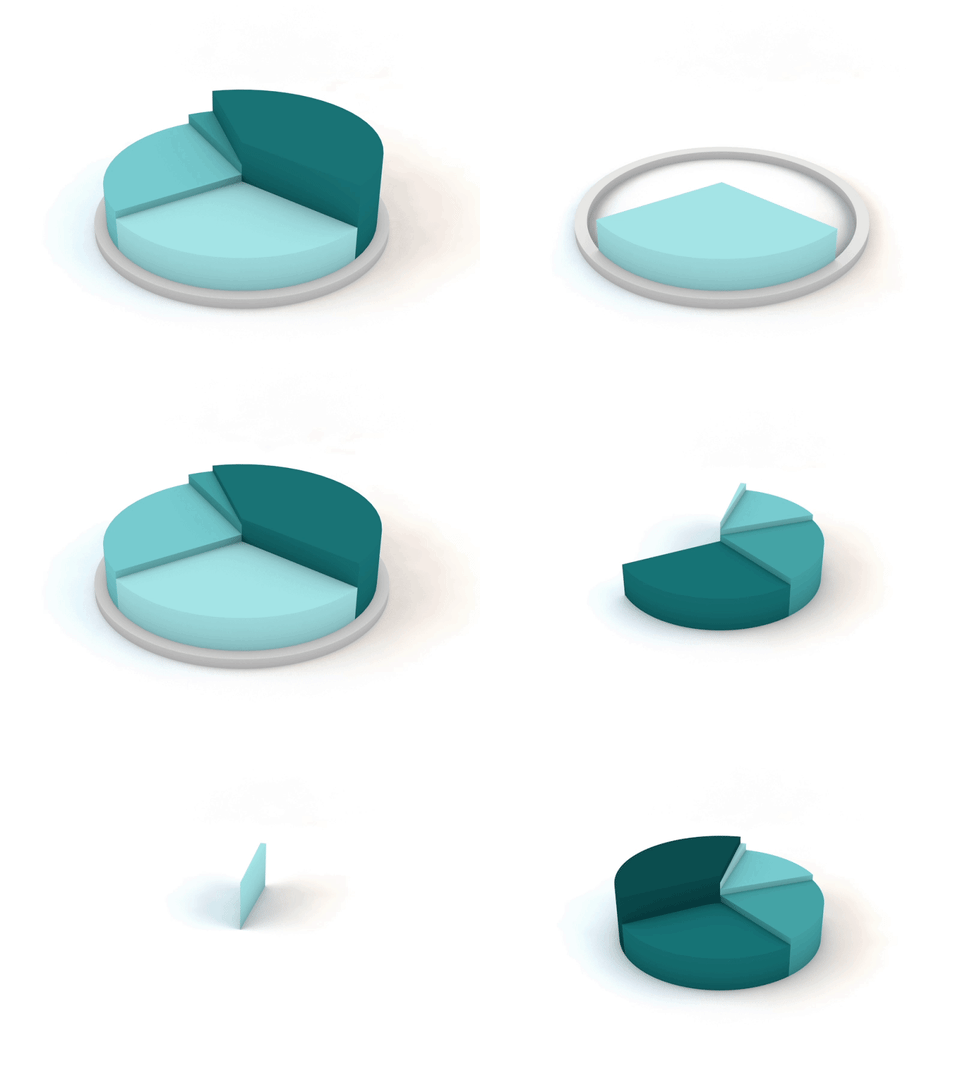
1. Simplifies Dense Information: Charts, statistics, processes, and data can be presented through movement instead of relying solely on blocks of text.
2. Directs Attention: Animation can guide viewers toward important figures, comparisons, trends, and key information.
3. Makes Data More Memorable: Visual movement combined with structured information can help audiences retain important points.
4. Fits Multiple Content Formats: Animated infographics work well for presentations, social media, corporate videos, websites, reports, and marketing campaigns.
ANIMATED INFOGRAPHICS FOLIO
Animated infographics give businesses a more engaging way to present statistics, processes, comparisons, and information-heavy content. Businesses that have used animated data visualization benefit from clearer communication, stronger audience attention, easier information consumption, and more versatile presentation material. Your business can use the same advantages to make important information easier to understand and remember.
We begin by reviewing your data, information, audience, and communication objective. The information is organized into a logical visual structure, followed by graphic design, animation, timing, transitions, and refinement to ensure the final presentation remains clear and easy to follow.

Animated infographics combine data visualization, graphic design, typography, icons, charts, illustrations, and animation to present information through movement.
2. What information can be presented through animated infographics?
3. Can animated infographics follow my brand identity?
Yes. The design can incorporate your brand colors, typography, logo, icons, visual elements, and established design guidelines for a consistent presentation.
4. Where can animated infographics be used?
Animated infographics can be used in corporate videos, presentations, social media, websites, advertisements, educational content, reports, sales materials, and digital marketing campaigns.